
Benchmark Your Receivables Performance With Industry Standards
This scorecard will help you identify improvement opportunities in your receivables operations and quantify the potential savings.
This scorecard will help you identify improvement opportunities in your receivables operations and quantify the potential savings.
Receivables Performance Scorecard will rank your company’s A/R performance versus your peers in the industry. The Receivables Performance Index score is calculated based on three key components: Days Sales Outstanding, Allowance for Doubtful Accounts and Expenses Per Employee.

The Receivables Benchmarking Index comparison graph will depict the evolution of your receivables performance along with the Industry's Best-In-Class, Average and Laggards.

The Days Sales Outstanding Performance graph will compare your DSO standing with your Industry's Best-In-Class, Average and Laggards over a period of three years.

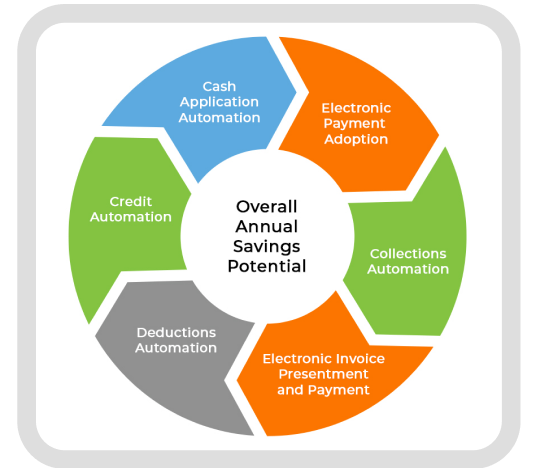
The ROI Analysis will help you build a foundational understanding of the different optimization opportunities which you can leverage to create a visible and direct balance sheet impact. This calculates the Overall Annual Savings potential which comprises of Savings from Cash Application, Electronic Payment Adoption, Collections Automation, EIPP, Deductions Automation and Credit Automation.

HighRadius Corporation
2107 CityWest Blvd,
Suite 1100,
Houston, TX 77042