Decoding the Tech Giants: Microsoft and Google's O2C Metrics
Google fares better on DSO and DIO, but Microsoft wins with a negative cash conversion cycle. We unravel the O2C prowess of the tech leaders.
 Linkedin
 Facebook
 Twitter
 Copy url
1.3X
faster cash collection by Google
4.5X
DIO for Google vs Microsoft
4.5X
DPO for Microsoft vs Google
8X
better CCC for Microsoft

Ladies and gentlemen, in the ring tonight, we have two heavyweight contenders from the world of technology: Microsoft and Google.
These tech titans have been battling it out for years, dominating the industry with their innovative products and services.
But today, we won't discuss search algorithms or operating systems. We're diving headfirst into the realm of finance to compare the Account Receivables metrics of these tech titans.
So, grab your calculators and get ready to witness a working capital clash like never before. Let’s dissect the balance sheets and uncover the secrets behind the cash machines at Google and Microsoft.
Google collects cash 1.3X faster than Microsoft
Accounts receivable turnover ratio (ART) is your go-to metric if you want to measure collections efficiency. A higher ART indicates that the business is more efficient in collecting its receivables.
Receivables turnover ratio = Net credit sales/average receivables
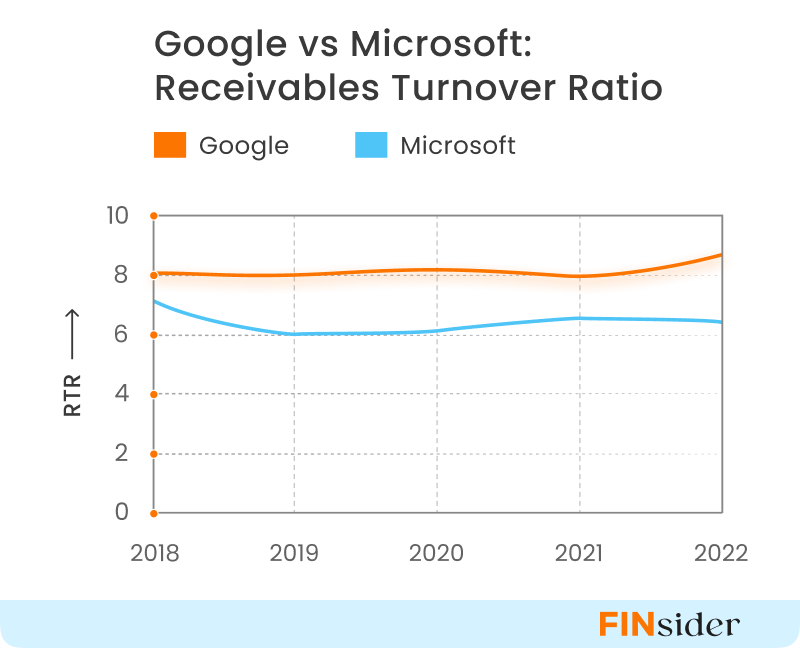
Google’s average ART for the last five financial years was 8 against Microsoft’s 6. This means that Google collects almost 1.3X faster than Microsoft.
This is because Google derives a large portion of its revenue from advertising, where payments are typically received within shorter days. Microsoft, on the other hand, has a more diverse revenue stream including devices, server products, cloud services, and enterprise services which have longer payment cycles.
Microsoft vs Google: Cash Conversion Cycle varies significantly
The Cash Conversion Cycle (CCC) is a handy way for companies to measure how efficiently they convert the cash they invest in inventory back into cash.
It is influenced by how long you keep inventory (DIO), take to pay suppliers (DPO), and receive cash from customers (DSO).
CCC = DSO + DIO – DPO
DIO: Days Inventory Outstanding is the average number of days a company holds inventory before selling it.
DPO: Days Payable Outstanding is the average number of days it takes for a company to pay its suppliers.
DSO: Days Sales Outstanding is the average number of days it takes for a company to collect credit payments from customers
A shorter CCC is preferable as it means that cash isn’t tied up in inventory or accounts receivable and moves faster through your business.
Microsoft is a master at this game. It collects cash from customers faster than it takes to pay suppliers or hold inventory. Their cash conversion cycle has averaged a remarkable 4 days over the last five financial years.
On the other hand, Google’s CCC averaged 31 days for its last five financial years.
Let’s compare the three metrics that impact the cash conversion cycle to dive into the contrasting numbers for Google and Microsoft.
DSO: Google is better at collections than Microsoft
Days Sales Outstanding (DSO) measures how many days it takes for a company to collect money from customers after a credit sale.
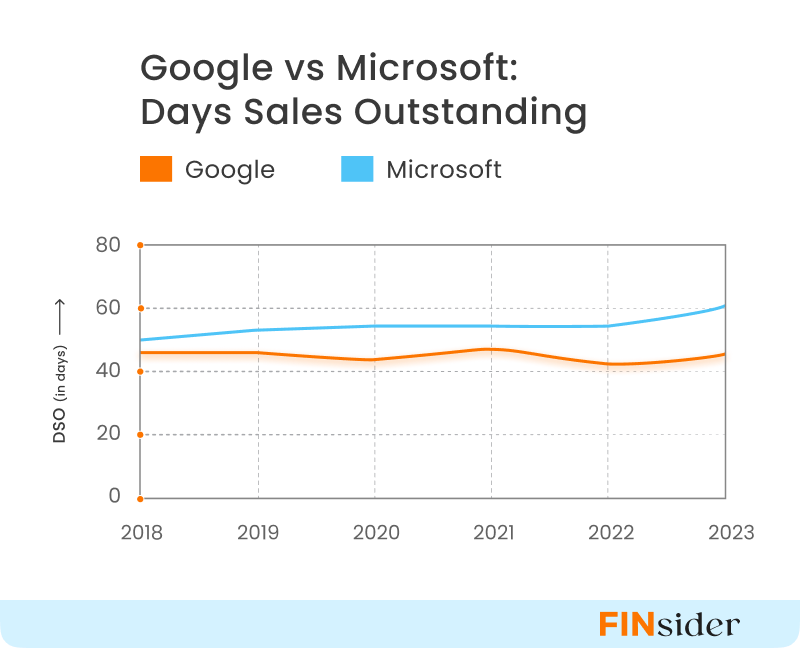
Google’s average DSO for the last five years is 45 days, while Microsoft’s is 55 days. To gauge their standing relative to peers, we examined industry averages. For internet companies, the average DSO is 85 days, while for computer companies, it is 78 days.
Both Google and Microsoft collect money from customers way faster than an average internet or computer company.
Why is Google’s DSO lower than Microsoft’s?
Here are a few reasons why Google is able to collect faster than Microsoft.
- Business model differences: Google’s main revenue driver is online advertising (constituting ~80% of total revenues in 2022). This business unit generally sees short payment cycles. In 2022, Google’s ad revenue amounted to $224.47 billion, whereas Microsoft’s $211 billion revenue was mostly from software licenses and cloud computing, a business that has longer billing cycles.
- Customer base: Google Cloud is winning many gen-AI startups and unicorns as customers. More than half of all funded gen AI startups are Google Cloud customers, including 70% of gen AI unicorns. Smaller companies tend to pay invoices faster than enterprises to build strong supplier relationships.
DIO: Google clears inventory 4.5X faster than Microsoft
Days Inventory Outstanding (DIO) is an indicator of inventory management success. It indicates how fast inventory gets sold.
For Google, DIO averaged 4 days in the last five financial years while for Microsoft it was about 18 days.
Why is Microsoft’s DIO higher than Google’s?
Here are some reasons why Microsoft’s DIO is higher than Google’s:

- Long-term contracts: Microsoft’s sales come from long-term enterprise software and cloud contracts, resulting in a higher portion of deferred income.
- Higher physical inventory: Microsoft has a bigger hardware business (Xbox and PCs) compared to Google, leading to higher inventory levels and DIO.
- Lower hardware sales: Declining PC demand and lower revenues from Xbox hardware, content, and services drove up Microsoft’s deferred income and DIO.
- Digital-first business model: Google’s pay-per-click advertising revenue has no associated inventory as payments match the short billing cycles from ads displayed, keeping its DIO lower.
DPO: Microsoft’s DPO is 4.5X higher than Google
Days Payables Outstanding (DPO) measures the average number of days a company takes to pay its suppliers.
Microsoft reported an average DPO of 77 days in the last five financial years while Google’s average DPO was 18 days. This indicates that Microsoft pays its suppliers much later after collecting its own revenue dues.
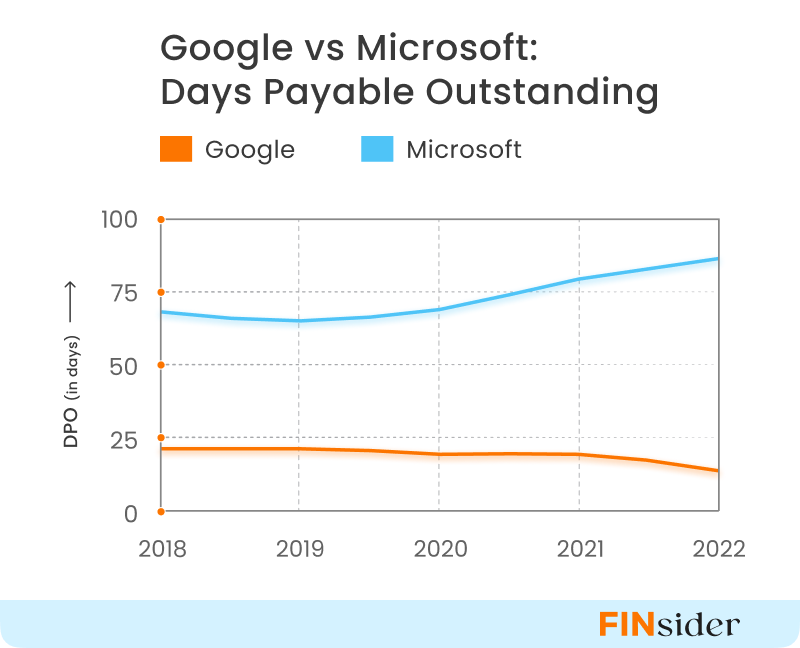
Microsoft increased its DPO from 68 days in 2018 to 89 days in 2022, while for Google the DPO reduced from 21 days to 12 days during the same period.
The longer DPO helps Microsoft have a negative cash conversion cycle and better cash flow management despite its DSO and DIO being higher.
Reasons for the difference in DPO
Let’s look at some factors that impact the DPO of both tech giants.
Supplier network: For a majority of its products, Microsoft has the ability to source materials from other suppliers if an existing vendor is unavailable or unable to meet business requirements. This allows Microsoft to seek more favourable credit terms from suppliers.
Google, on the other hand, is dependent on one or a limited number of vendors for some of its technical infrastructure and hardware. To maintain uninterrupted supplies, Google likely pays its vendors sooner.
Intangible costs: In addition to hardware components, Google also pays third parties for other services such as traffic acquisition for Chrome (web browser) and the Play Store. Such expenses are generally paid upfront, reducing the DPO for Google. Traffic acquisition cost for Google was ~$49 billion in 2022, an increase of 7.5% YoY.
While Microsoft doesn’t explicitly report TAC, it is estimated to be much lesser than Google’s, considering that search and news advertising constitutes only 6% of its total revenues.
Conclusion: A fight of equals
While Microsoft and Google are often mentioned in the same breath, the many structural differences in their customer base and business operations give them varied strengths. This is also reflected in their cash flow metrics.
Google is a leader in the online search and digital advertising space while Microsoft boasts of a substantially larger cloud business (Azure). Google collects payments faster and clears inventories sooner because of its online business.
Microsoft, on the other hand, has better bargaining power with suppliers. This enables it to have a shorter cash cycle despite its DSO and DIO being higher than Google’s.
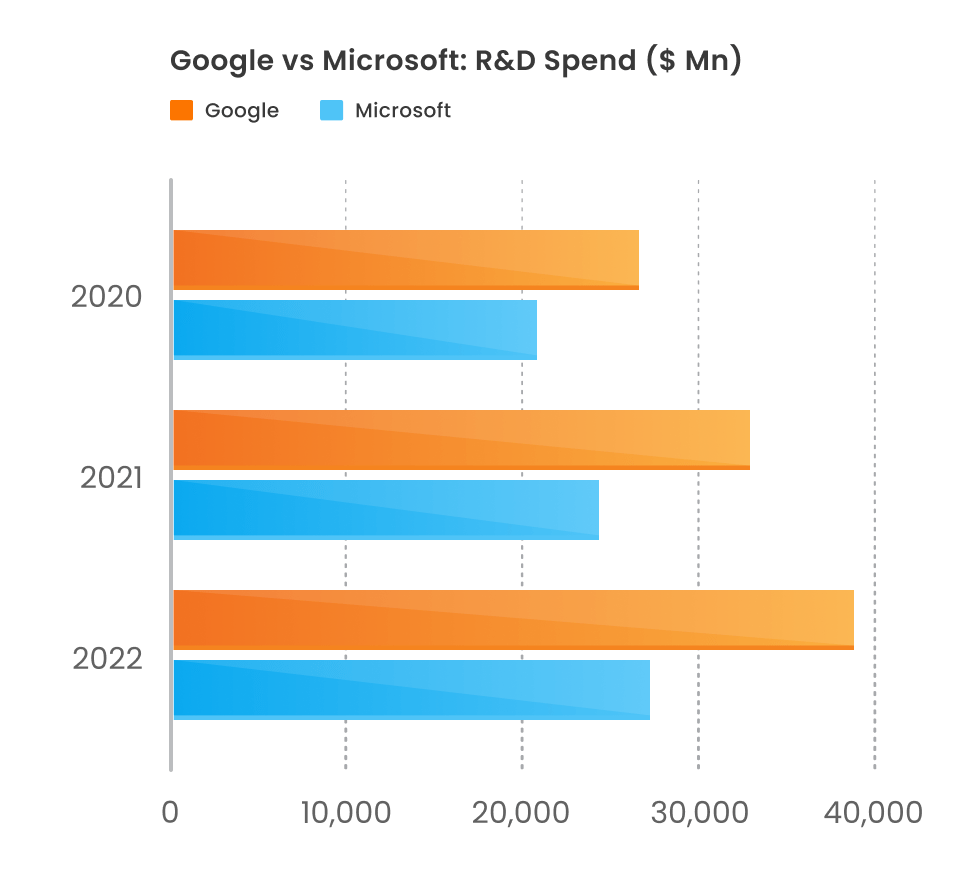
With the aim to be the leader in the AI space, both Microsoft and Google have upped their research & development budgets. Microsoft spends 13% of its revenue on R&D, while Google’s is a tad higher at 14%. Both are also making strategic investments in AI technology via acquisitions.
With deep pockets (Google has $22 billion in cash and cash equivalents while Microsoft has $34 billion) and sky-high ambitions, both tech giants are equally strong contenders to be the ultimate tech king.
*Note: Microsoft follows July-June as its financial year. Google’s financial year is from Jan – Dec.


