To achieve your revenue and collection goals, having a roadmap with regular checkpoints and actionable steps is crucial. Data plays a vital role in understanding operations and customer experience, and fortunately, there’s plenty of data available today.
But which metrics should you focus on to effectively measure success and make informed business decisions? Which metrics truly impact your receivables process? In this guide, we’ll help you find the answers.
Choosing the right Key Performance Indicators (KPIs) for Accounts Receivable Analytics can be overwhelming, considering so many metrics. To help you kickstart your AR performance measurement, we’ve gathered insights from seasoned finance experts and identified the 10 best metrics to focus on:
Check out our “Cash Flow Statement Analysis” guide for step-by-step instructions on measuring the metrics covered in this post, plus several more on financial statements like cash flow, income, and balance sheets.
Data can be intimidating—all those charts, numbers, and spreadsheets. Tracking all the crucial accounts receivable metrics manually is nearly impossible. Fortunately, there are automated tools available that streamline the tracking process. These tools enable you to capture, process, and iterate on AR performance metrics effortlessly.
An integrated receivables tool is a game-changer for efficient financial management. By providing a unified platform to store customer and transaction information, it simplifies and accelerates the collections and overall receivables process. With automated data collection and analysis, finance teams save time and gain AI-driven insights for improved cash management.
With solutions like HighRadius’s autonomous receivables, managers gain complete visibility into aging analysis and can track progress across the receivables cycle. Our software enables you to gather, analyze, and leverage customized financial metrics tailored to your business needs. With advanced reporting and customizable dashboards, identifying trends and optimizing your processes becomes a breeze.
Save yourself from end-of-quarter surprises with accurate forecasting and manage your aging buckets in real-time. Watch a 2-min video on unlocking complete visibility to plan, track, and analyze your collections process without heavy lifting.

ERP systems are powerful tools that automate processes across the receivables cycle, serving as a reliable source of truth for all your data and technology needs. As businesses grow, managing complex operations becomes easier with ERP software.
With ERP systems, manual process tracking errors are reduced, and finance teams gain access to ready-made reports and dashboards, enhancing efficiency and user experience.
However, it’s important to note that while ERP systems offer numerous benefits, they are designed to cater to multiple industries and may not be tailored specifically to one particular segment.
Point solutions are specialized software that focus on specific functions within the receivables cycle. They offer a comprehensive view of the particular function and its associated metrics.
These solutions can be integrated with larger ERPs or integrated systems, enabling you to assess process sentiment and generate reports that highlight trends and performance.
While point solutions may initially seem affordable and reliable for immediate needs, they can become inadequate as your business scales and evolves. They may struggle to keep up with the changing landscape of your growing business in the long run.
While not as sophisticated as ERPs or point solutions, spreadsheets can still be effective tools for tracking accounts receivable analytics. You can create customized spreadsheets to capture relevant data, calculate KPIs, and generate reports. Spreadsheets offer flexibility and can be easily customized to suit your specific requirements, making them a popular choice for smaller businesses or those starting with basic analytics.
When choosing the right tool for your accounts receivable analytics, consider factors such as the size and complexity of your business today and for tomorrow, the level of automation required, and your budget. Click here to learn more about selecting the right tool for your business’s accounts receivable analytics.
Sometimes, we can be overwhelmed with too much information and lose our way. This is especially true with all the data and metrics available to measure how well we collect receivables and build our cash flow.
In this guide, we’ve defined a path through all that data and provided some expert advice about how to best use the metrics that we’ve found essential for managing your own receivables operations. We hope that you’ve found it useful.
You can learn more about the tools we use to measure all of our essential metrics at https://www.highradius.com/autonomous-finance/

Positioned highest for Ability to Execute and furthest for Completeness of Vision for the third year in a row. Gartner says, “Leaders execute well against their current vision and are well positioned for tomorrow”

Explore why HighRadius has been a Digital World Class Vendor for order-to-cash automation software – two years in a row.

HighRadius stands out as an IDC MarketScape Leader for AR Automation Software, serving both large and midsized businesses. The IDC report highlights HighRadius’ integration of machine learning across its AR products, enhancing payment matching, credit management, and cash forecasting capabilities.

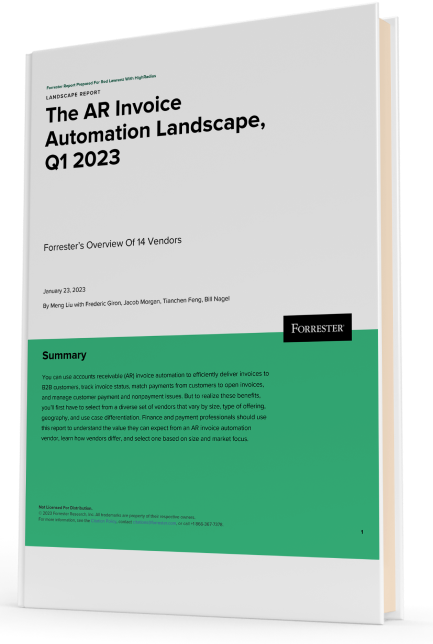
Forrester acknowledges HighRadius’ significant contribution to the industry, particularly for large enterprises in North America and EMEA, reinforcing its position as the sole vendor that comprehensively meets the complex needs of this segment.
Customers globally
Implementations
Transactions annually
Patents/ Pending
Continents
Explore our products through self-guided interactive demos
Visit the Demo CenterPlease fill in the details below
Please fill in the details below

We have seen financial services costs decline by $2.5M while the volume, quality, and productivity increase.

Colleen Zdrojewski
Trusted By 1300+ Global Businesses


