4 Blind Spots in Cash Forecasts
Discover the four blind spots in cash forecasting. Learn the best practices to capture those blind spots to boost cash forecast accuracy.
What are the blind spots in cash forecasts?
Blind spots in cash forecasting are areas that treasury teams often miss out on capturing due to limitations in data, technology, or drill-down capabilities. If the blind spots are not incorporated into the cash flow forecasts, it leads to:
Cash forecasts that are subpar or incomplete.
Cash forecasts that are low on visibility and accuracy.
The examples of blind spots in cash forecasting are as follows:
- Customer data: Customer data refers to their personal, behavioral, and demographic details. In cash forecasting, it is difficult to capture customer’s payment trends and patterns and predict the specific due date for each customer.
- External data: External data refers to broad economic indicators such as raw material price fluctuations or currency fluctuations that deviate frequently or are unpredictable.
- Seasonality: Seasonality refers to the variations in sales that occur at specific regular intervals such as weekly, monthly, or quarterly. For instance, some companies might experience their peak sales during the winters, while another company might profit during the summers.
- Variance: Variance in cash forecasts refers to the deviation between the forecasts and actuals, or forecasts vs. forecasts. If the actuals are greater than forecasts, it leads to favorable variance, whereas if the actuals are lesser than forecasts, it leads to unfavorable variance.
Why is it difficult to capture the blind spots?
Numerous factors make it difficult to incorporate blind spots in cash forecasts. The reasons are stated below:
- Customer data: Customer data is hard to capture since every customer has a different payment pattern/behavior. Despite agreeing on the payment terms, customers are sometimes unable to adhere to them. This makes A/R a very difficult category to forecast. Since companies also face various market/sales fluctuations, it leads to unpredictable payment patterns.
Without having a historic analysis of the customer’s past payment patterns, it is difficult to predict payment due dates. Using spreadsheets to track customer payment dates is inefficient as it limits the use of multiple customer-level variables. Sometimes payment behaviors can’t be tracked accurately through the average days to pay or ADP approach, since the accounts might have nuances that are too complex to capture. The repercussions of not tracking customer data accurately are:
- Poor cash management
- High cash buffers
- Increased borrowing costs and debts
- External data: External data such as price fluctuations or currency dips are hard to capture due to changes in supply and demand and macroeconomic trends. The other factors causing such fluctuations are:
- Inflation
- Recession
- Currency fluctuations
- Geopolitical policies
- Trade/tariff laws
- Force majeure events
Black swan events can lead to a cash crunch without proactive planning.
- Seasonality: Seasonality is often hard to factor in because each business has different times for peak and low sales. If seasonality is not incorporated into the cash flow forecasts, it might lead to the following repercussions:
- Firms might face cash crunches during low sales
- They may face stock-outs during peak seasons
- They may not be able to maximize profit margins or benefit from cost
- Variance: Variance analysis is often overlooked or performed for limited durations at the global level. This is due to the lack of treasury’s bandwidth which is taken up by gathering data, or lack of proper technologies to track variance. Performing variance analysis for a single duration leads to analysis-paralysis for identifying discrepancies between forecasts and actuals. As a result, firms can’t take effective decisions to improve the efficiency of forecasts.
How to capture the blind spots effectively?
The best practices to capture the blind spots are as follows:
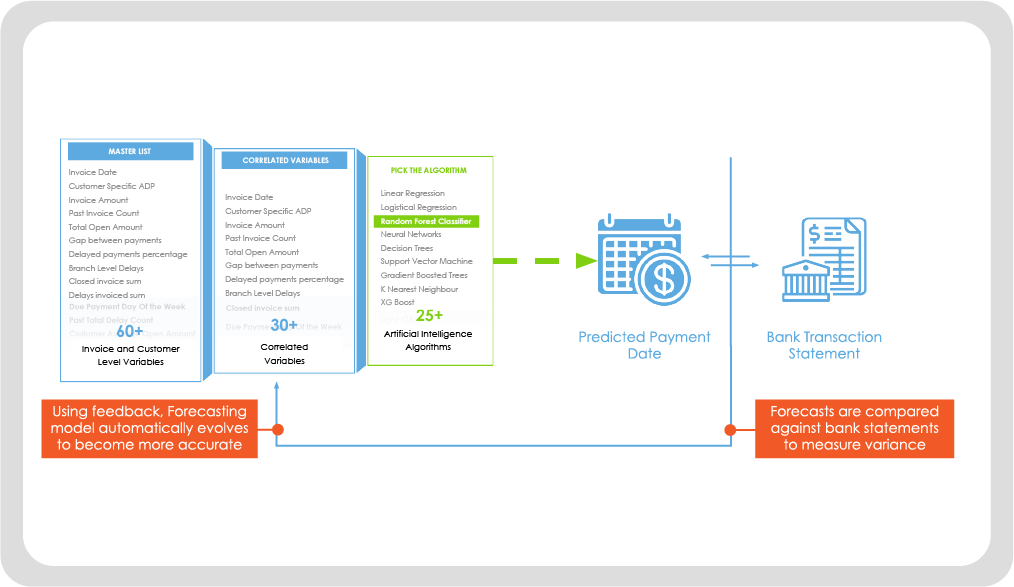
1. Customer data: Customer data can be gathered automatically using technology. The payment patterns can be captured with the help of Artificial Intelligence. AI performs a historical analysis and a regression analysis to understand the historical patterns associated with complex cash flow categories such as A/R and A/P and predict payment dates.
The figure below shows two curves, the one on the top right shows a curve that is spread out due to inefficient modeling. The curve below is less spread out and is sharper due to efficient modeling.
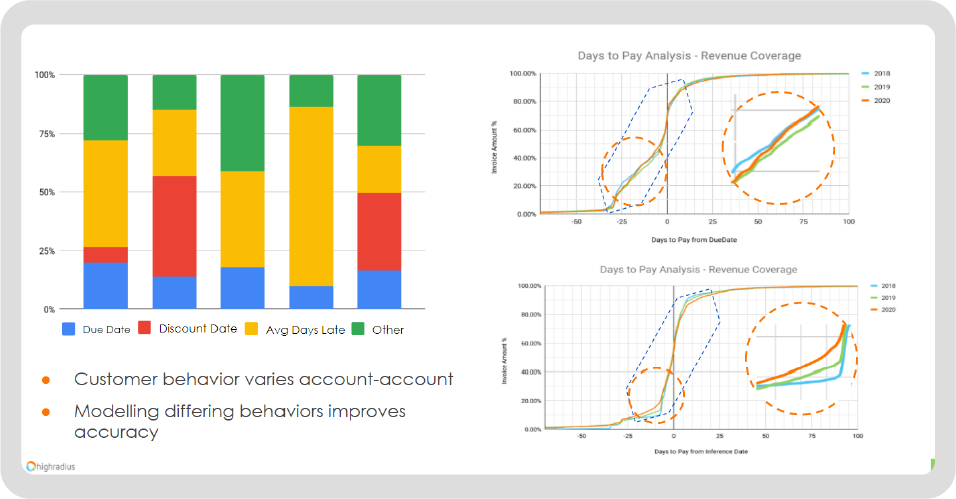
Source: HighRadius, Explained: The Data-Driven Approach to Accurate Cash Forecasting
2. External data: Incorporating the external data into AI-powered forecast models refines the forecasts, thereby enabling CFOs to take proactive measures.
The figure below shows two graphs. The graph on the top right shows the forecast without incorporating the influence of key raw material prices. The other graph shows improvement in the forecast by incorporating the influence of key raw material prices.

Source: HighRadius, Explained: The Data-Driven Approach to Accurate Cash Forecasting
3. Seasonality: Seasonality can be incorporated into the forecasts through time series algorithm and predictive analytics. The time series algorithm prioritizes the recent trends over historic trends to build accurate cash forecasts.
Through accurate time series modeling, treasury can comprehensively understand seasonal fluctuations. This makes it easier to capture market trends, maximize profits, stock-up for peak seasons, or prevent cash crunches through proactive borrowing during the off-seasons.
This is how the seasonality curve looks like in cash forecasts:

Source: Time Series Reasoning
4. Variance: AI helps in identifying variance between forecasts and actuals for long-term and short-term. Moreover, variance analysis can be performed for multiple durations across the entity, region, and cash flow category levels.
The closed-feedback loop reduces variance to achieve accurate forecasts by allowing AI systems to understand errors in past forecasts, and adjusting the parameters to perform better in the future.
Source: HighRadius
